Explore
Drag, compare, watch the city change.
Every picture here is made from the same data the app shows, or from the open aerial and satellite sources it is checked against. Pick a theme, then drag the handles. Sliders also work with the keyboard: focus one and use the arrow keys.
Three layers
Amsterdam and Utrecht, layer by layer.
Verified sites, then everything the satellites detected, then the early signals from the last twelve months. Drag the slider to blend between them.
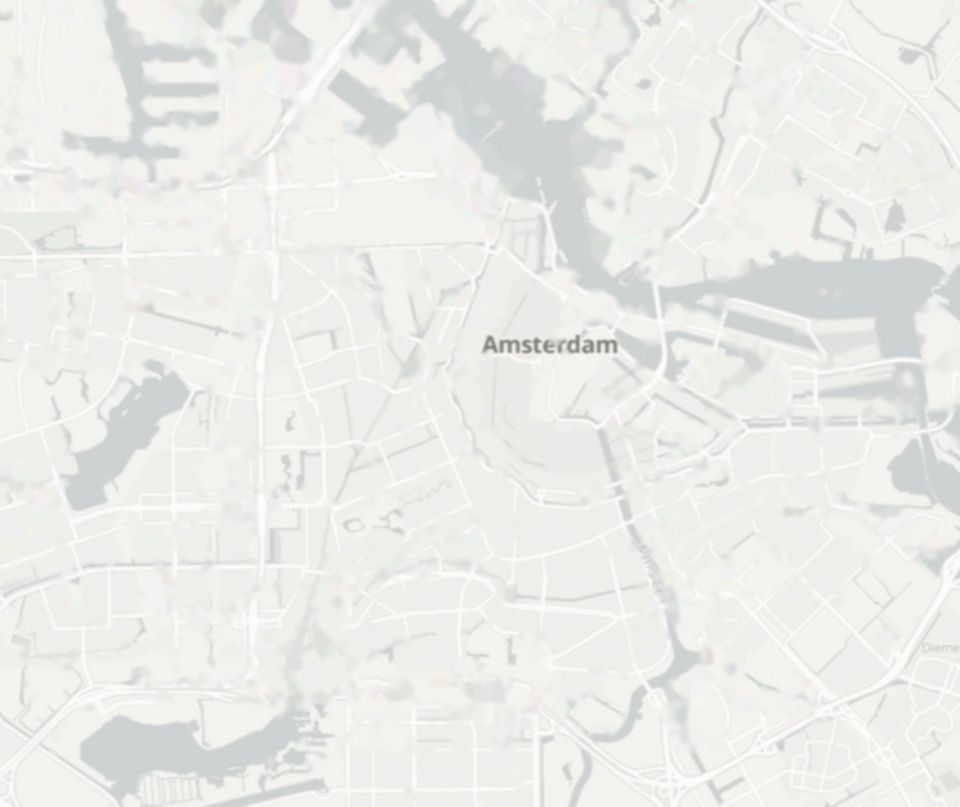
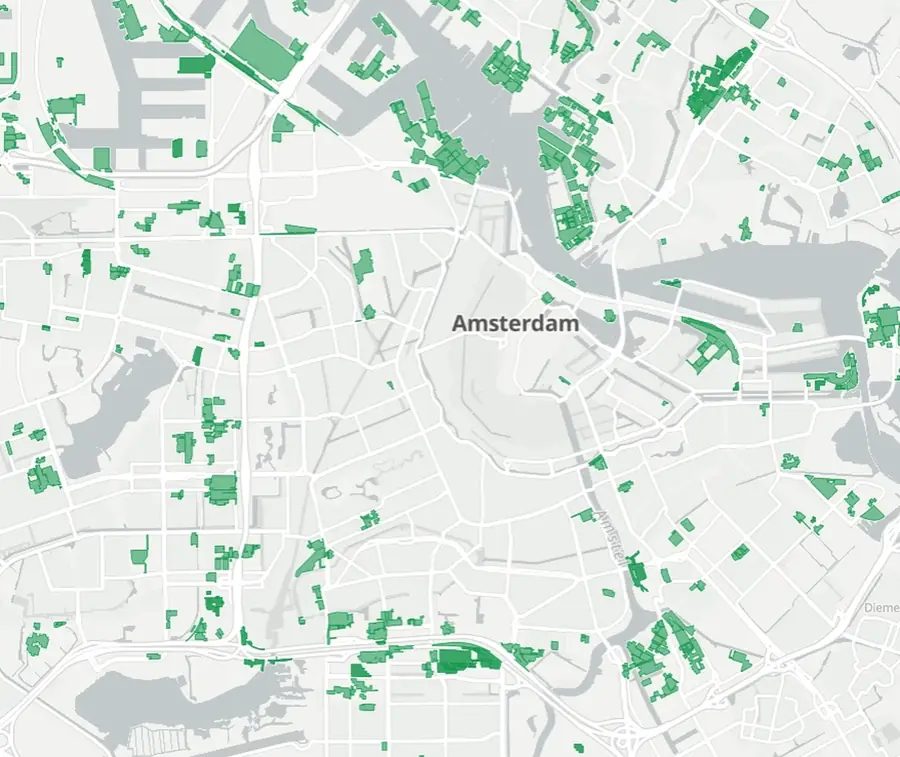
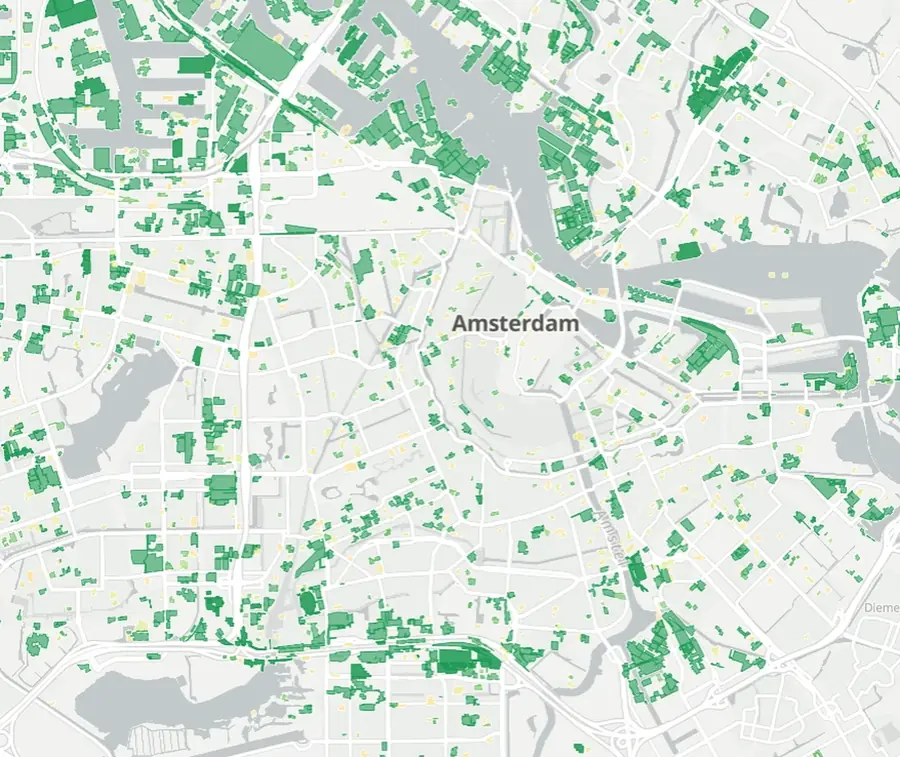
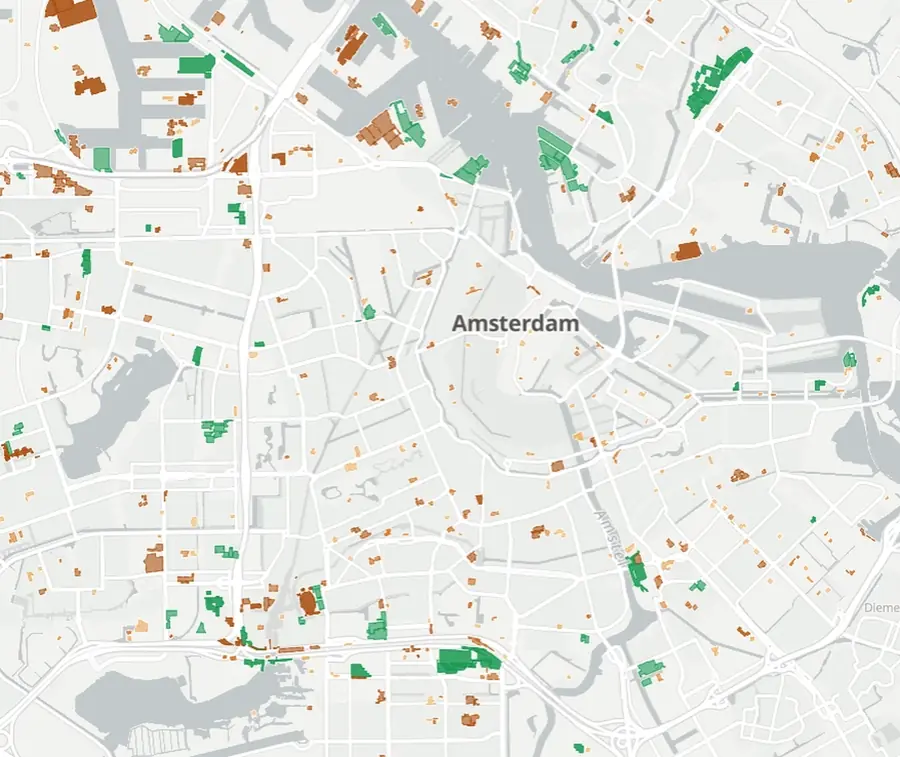
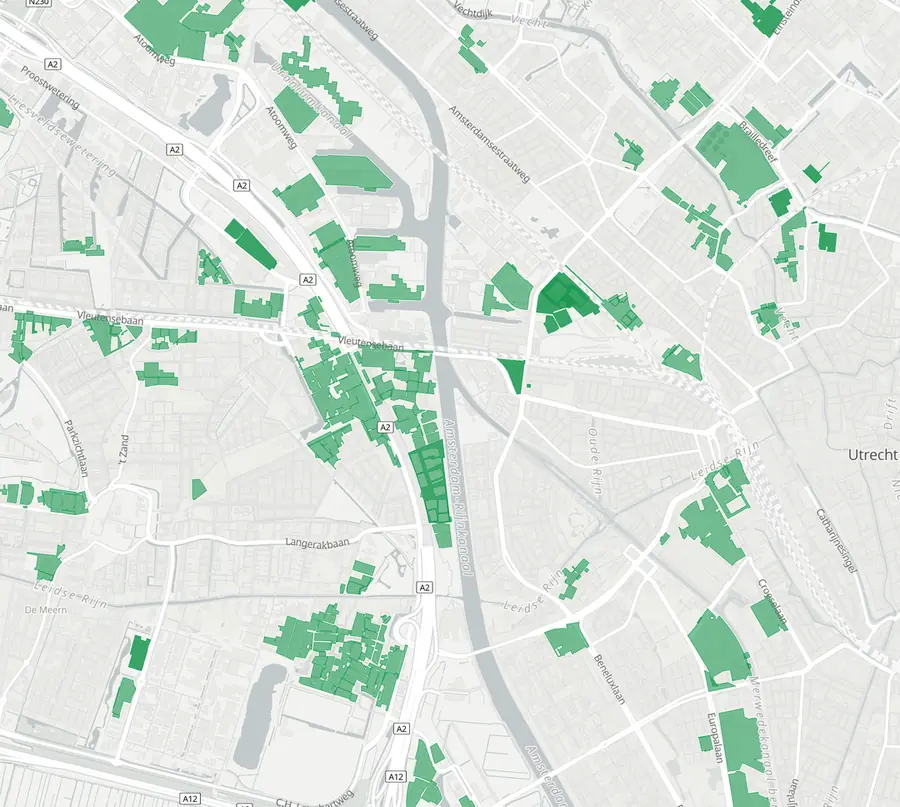
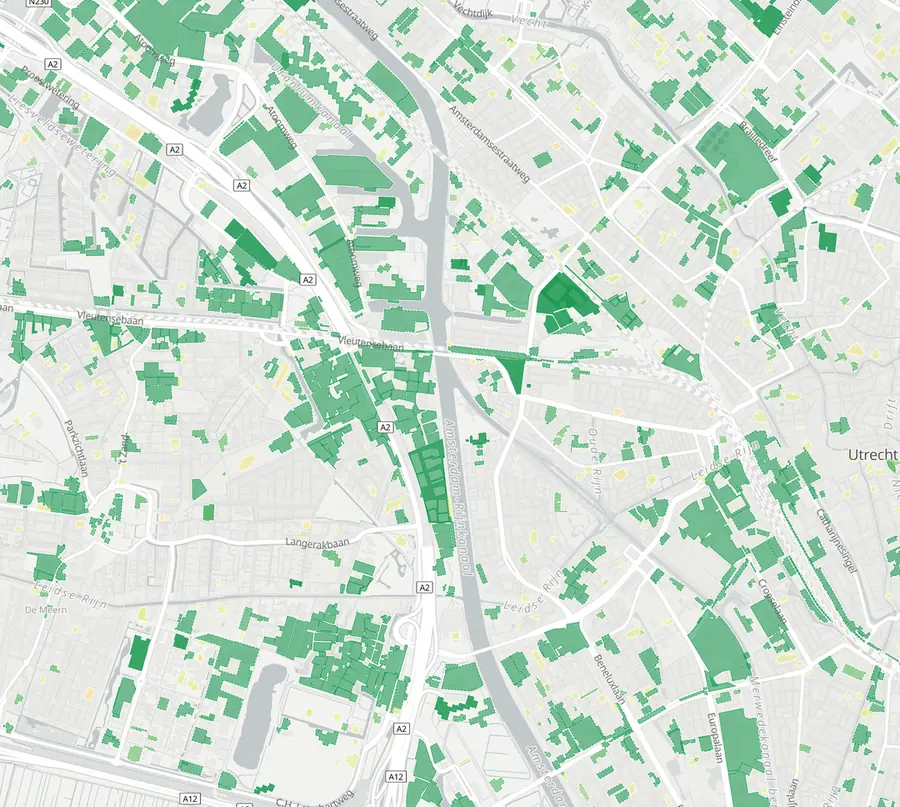
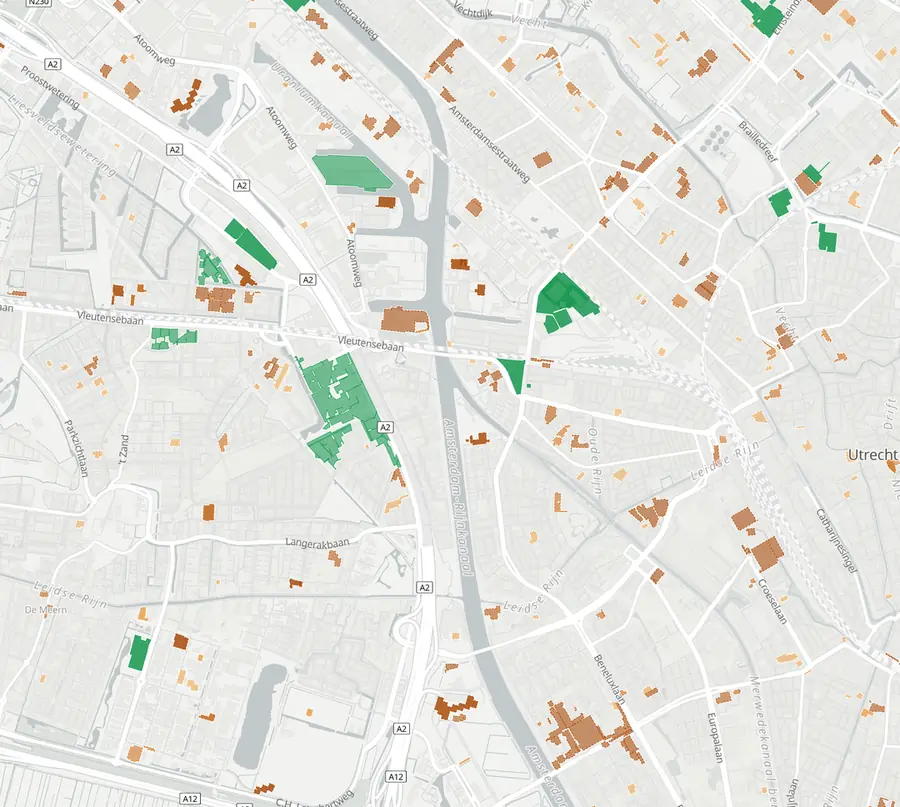
Counts are the published November 2026 figures. Map frames from the app. Basemap: OpenFreeMap, OpenMapTiles, (c) OpenStreetMap contributors. Buildings: BAG, Kadaster / PDOK.
Construction pulse
Amsterdam, month by month.
Each verified site lights up in the months its works are seen from orbit and goes dark when they wind down. The counter shows how many of the 357 register-verified sites were active that month, March 2019 to August 2026.
Start and end months are satellite estimates, so read it as the rhythm of construction across the city rather than a day by day record. The loop starts in March 2019 because the monitoring record ramps up through 2018 and that ramp-up would read as a boom.
See it for your cityFrom orbit
Four reported data-centre sites, before and after.
Hyperscale sites are the easiest class of construction to see from orbit: huge footprints, greenfield land, fast clearing. Each pair is two single clear Sentinel-2 scenes at 10 m, same season, same colour stretch. Compare pattern and shape rather than brightness. Site names and sizes are as reported in the press, not confirmed by the owners.
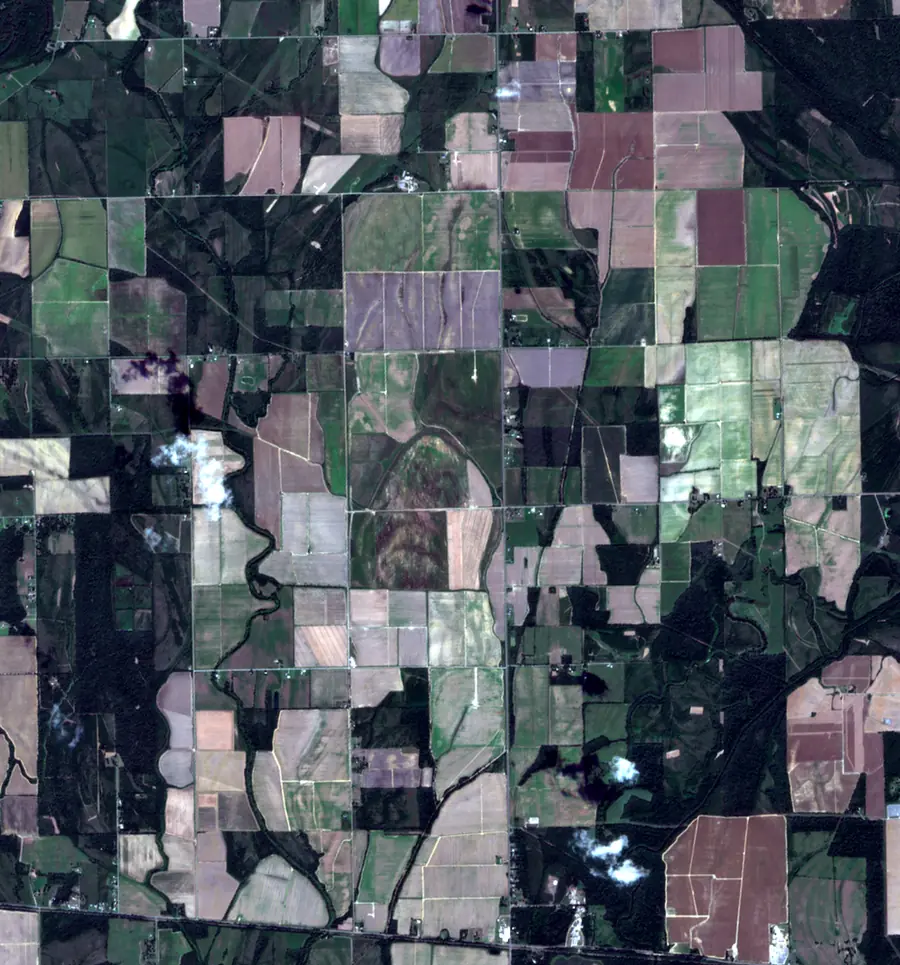
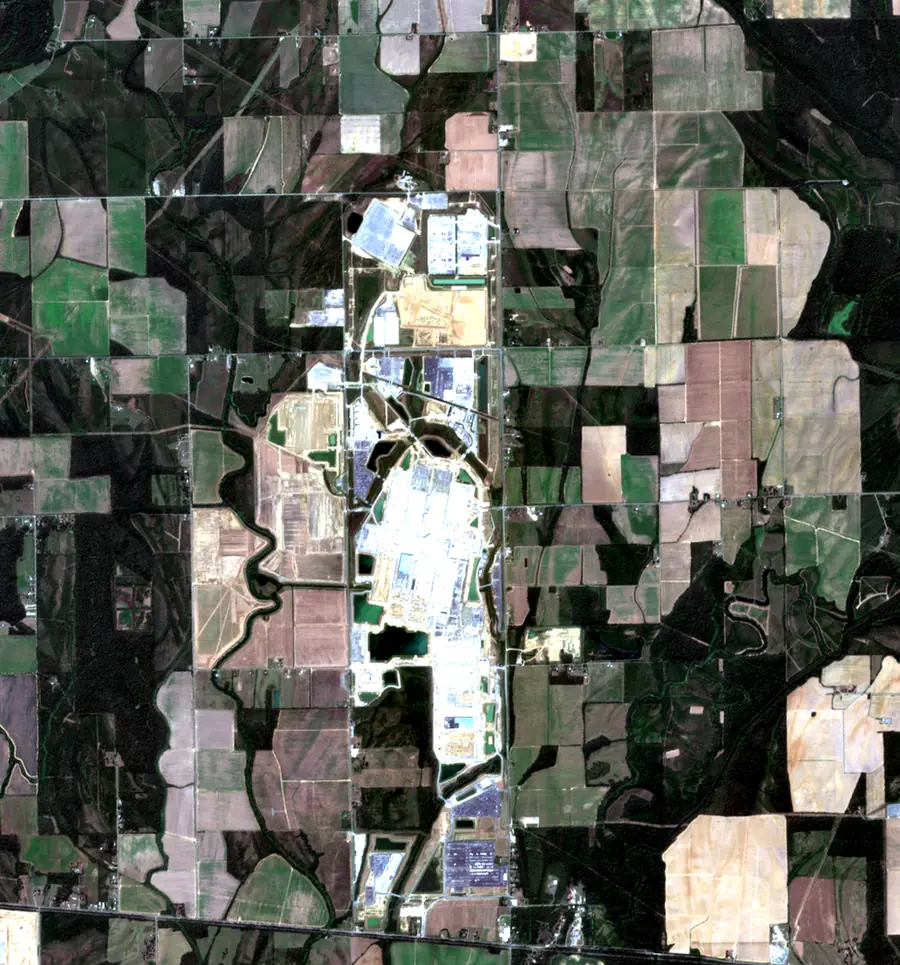
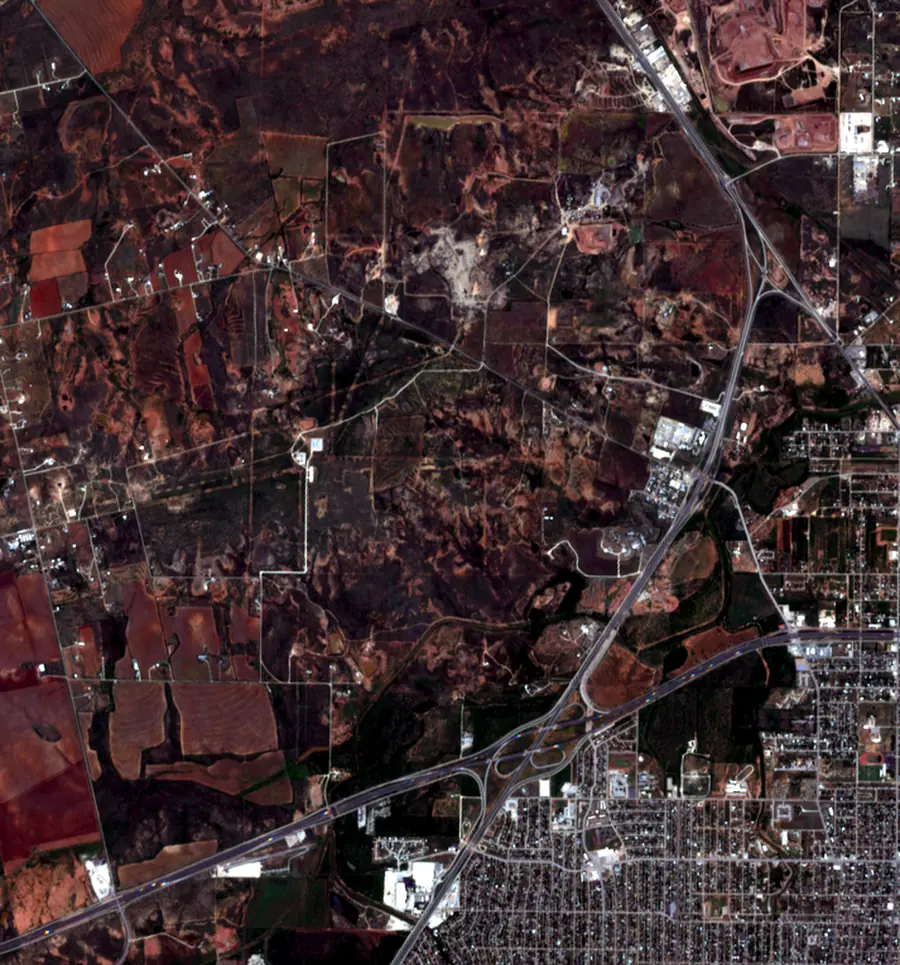
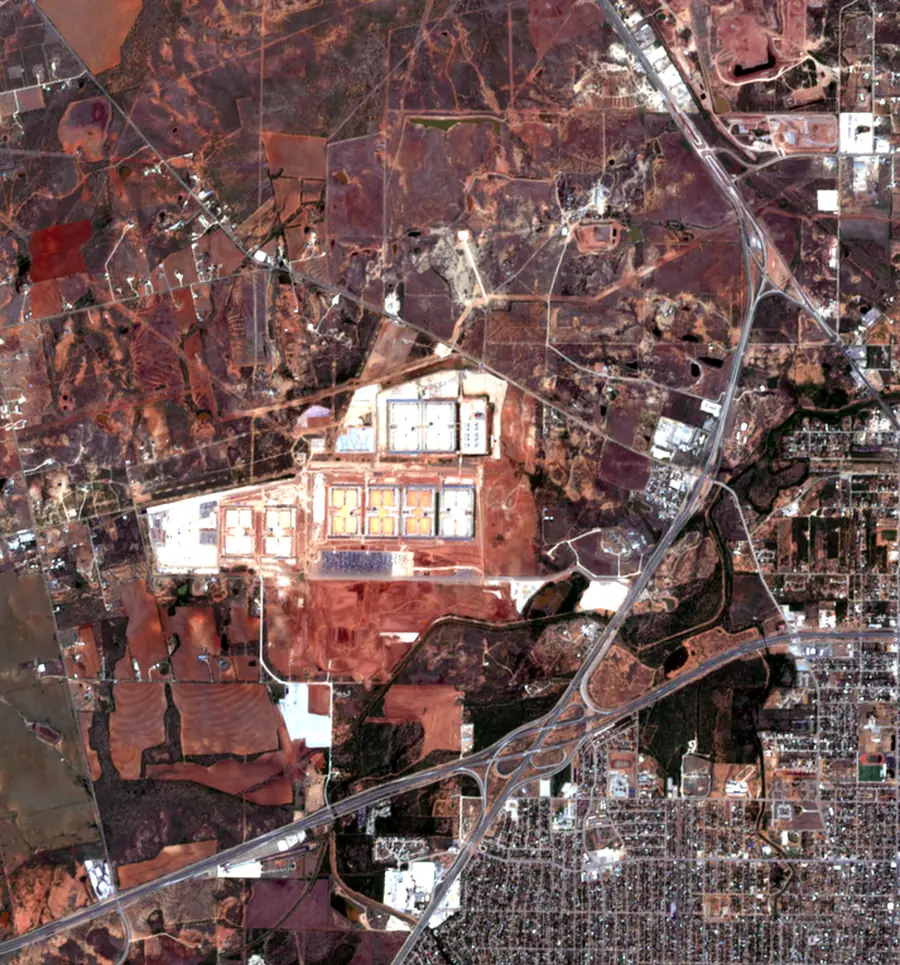
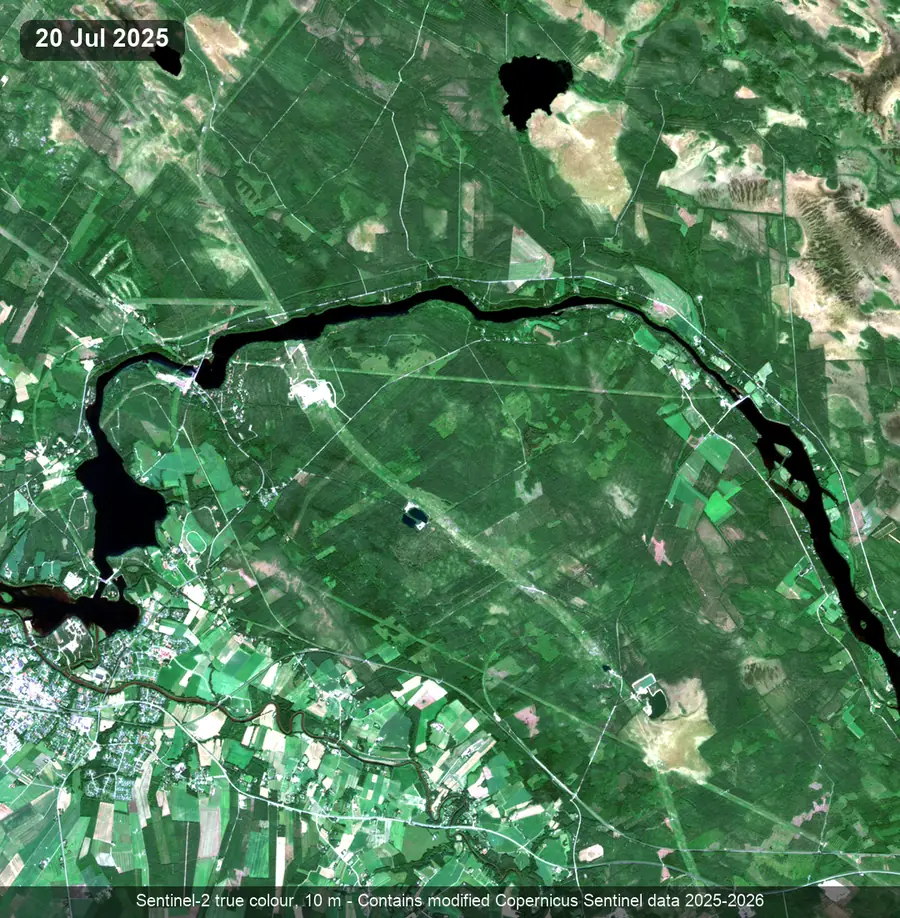
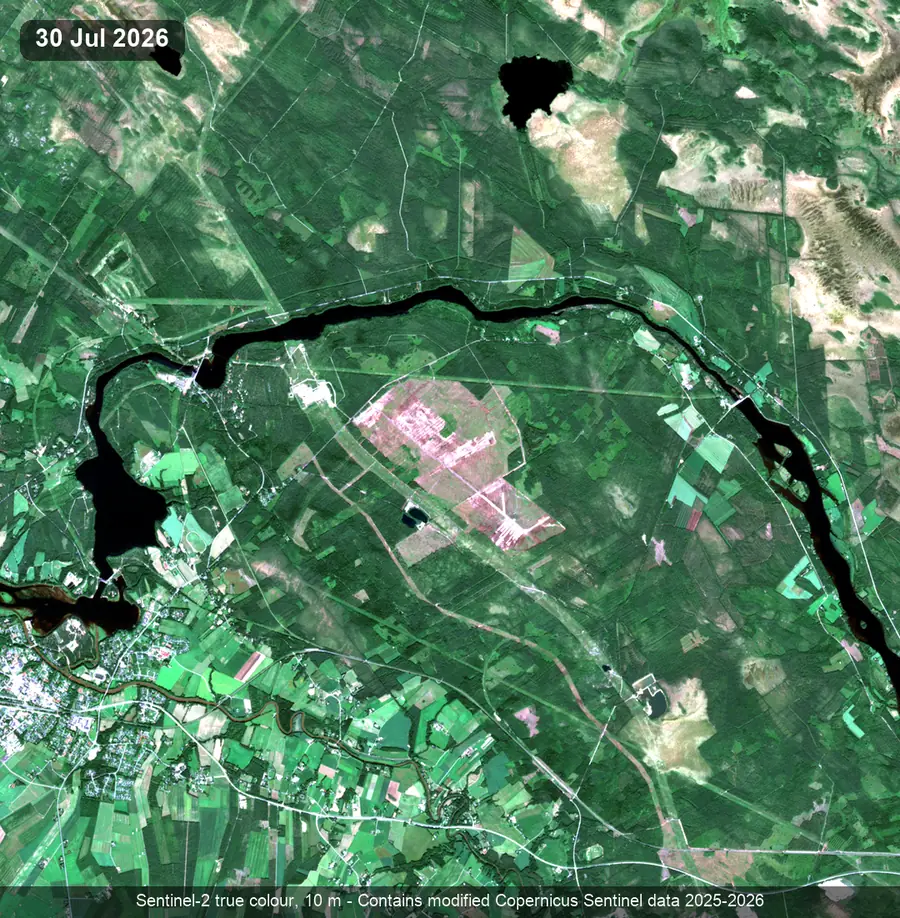
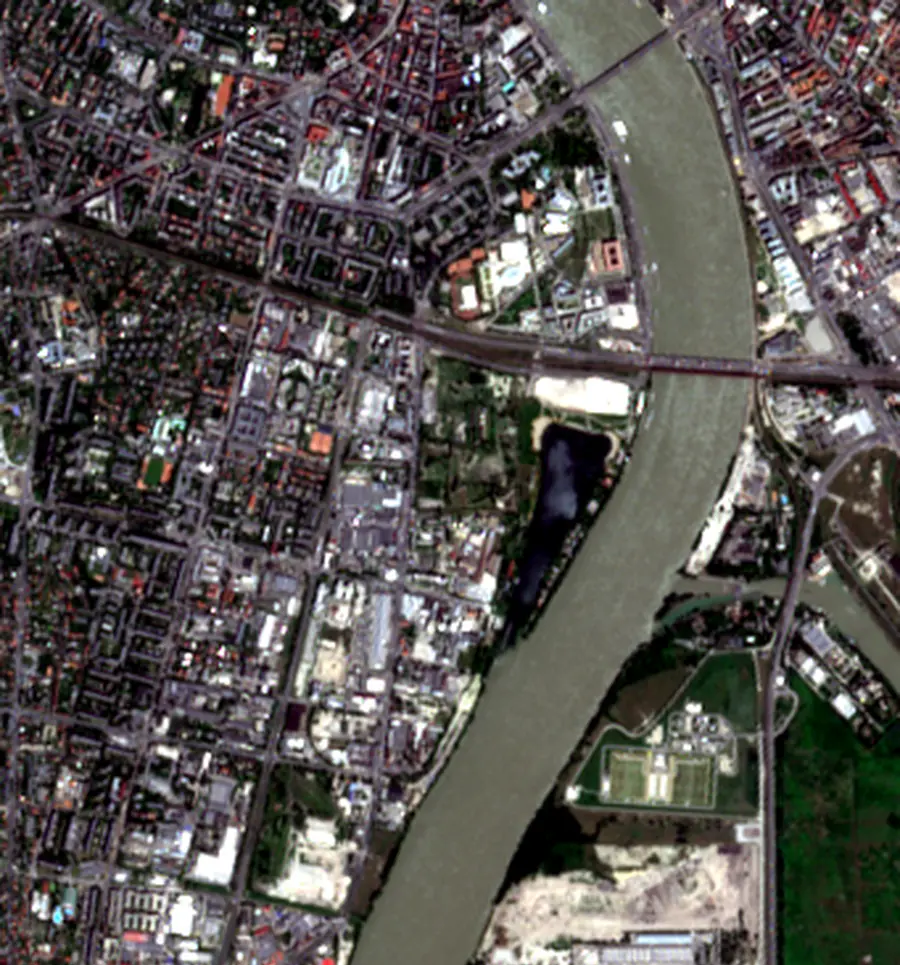
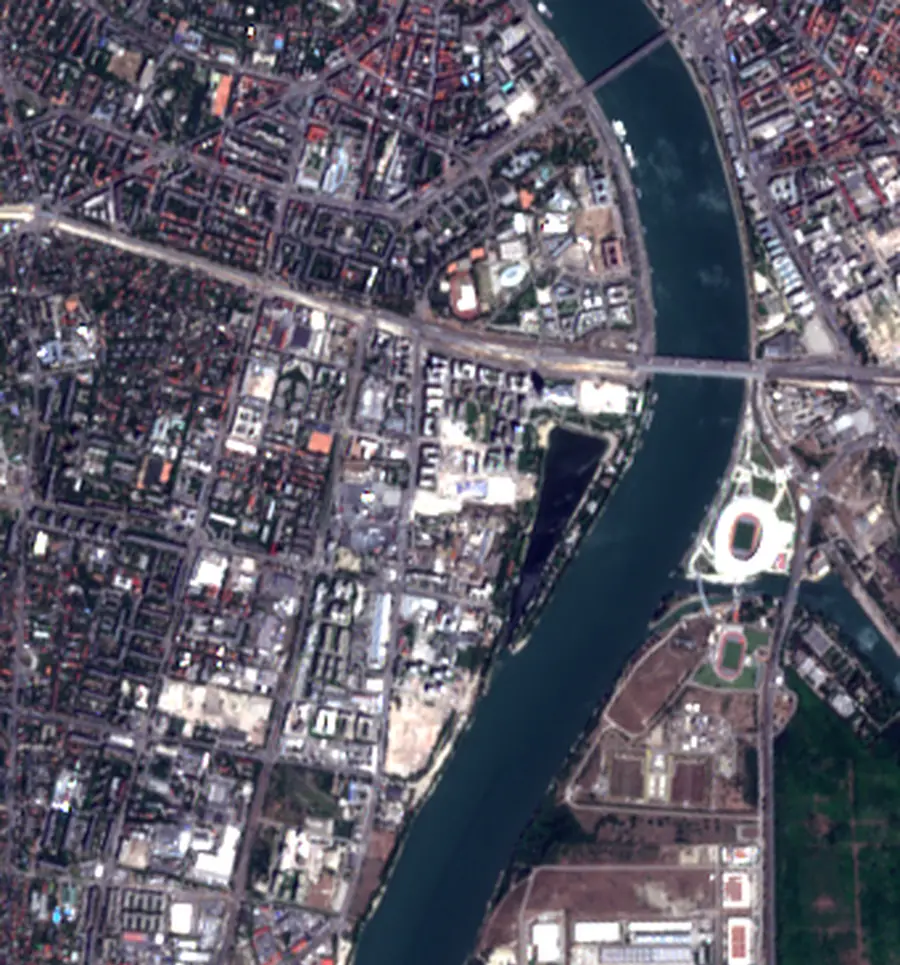
At 10 m single buildings are too small to count. New roads, ponds, cleared pads and large roofs are easy to see. The same lens monitors any list of announced projects, and the Amsterdam pilot already holds a register-corroborated cluster of data-centre-class sites in the port-west area.
Before and after
Ten years of Dutch ground, from the air.
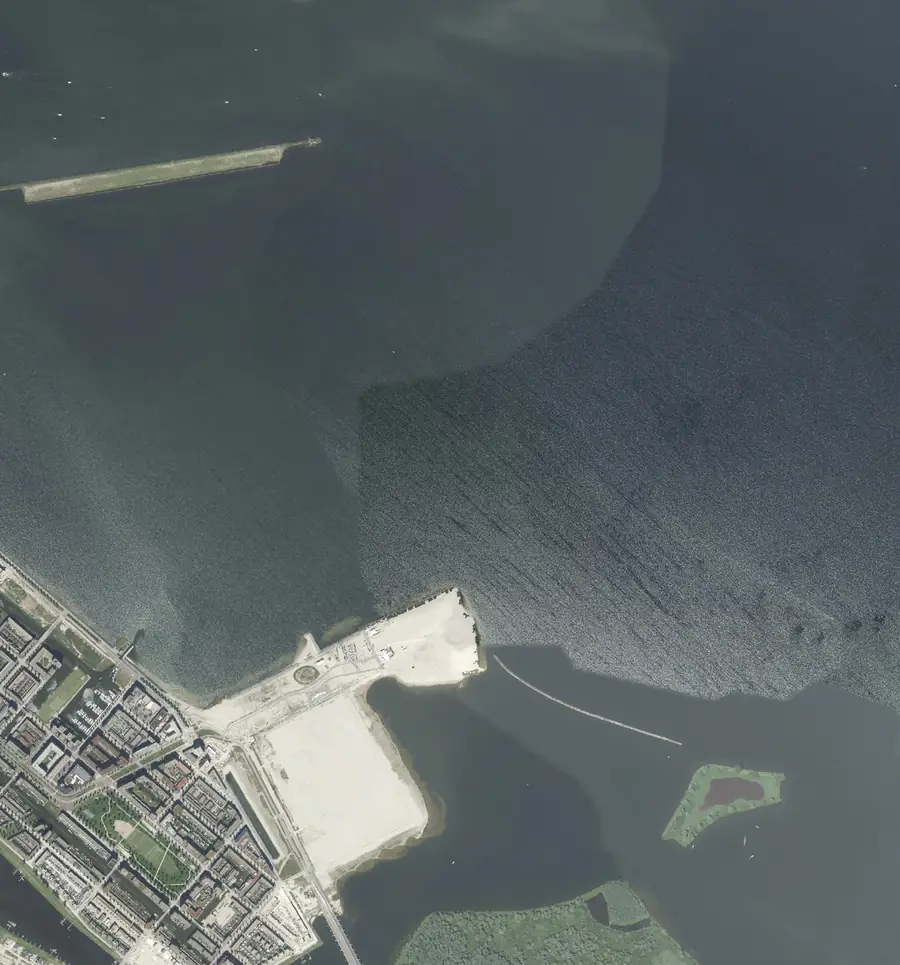
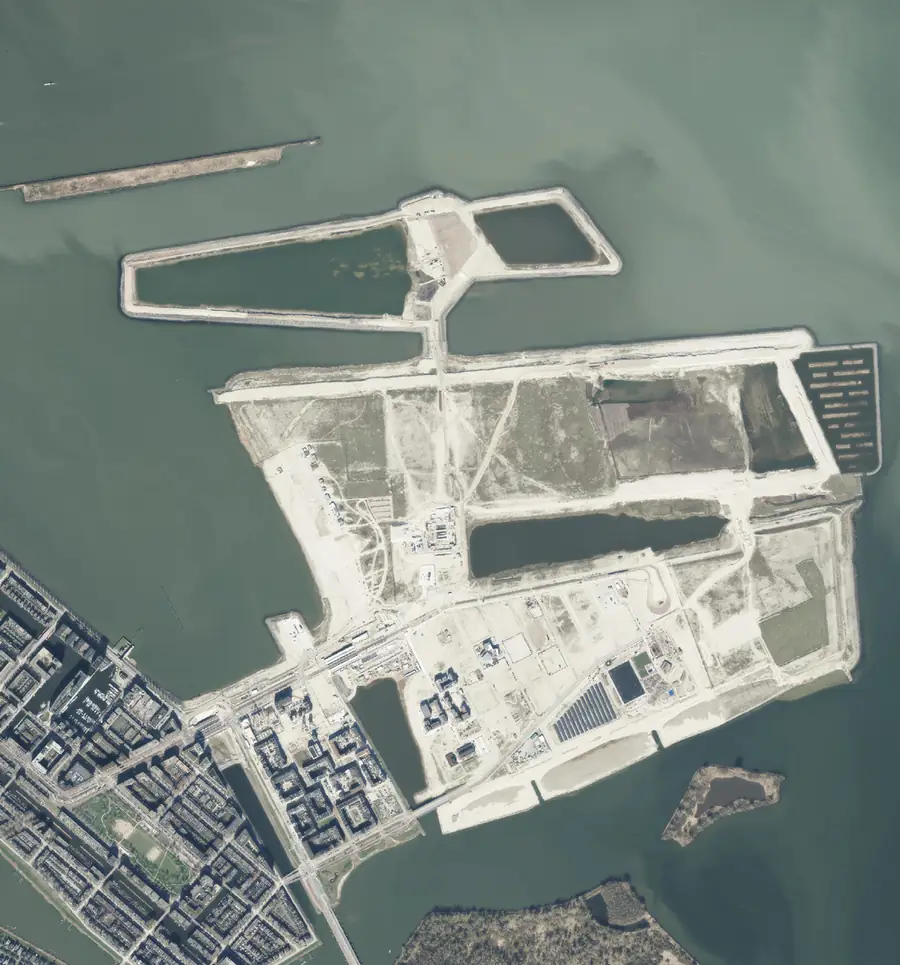
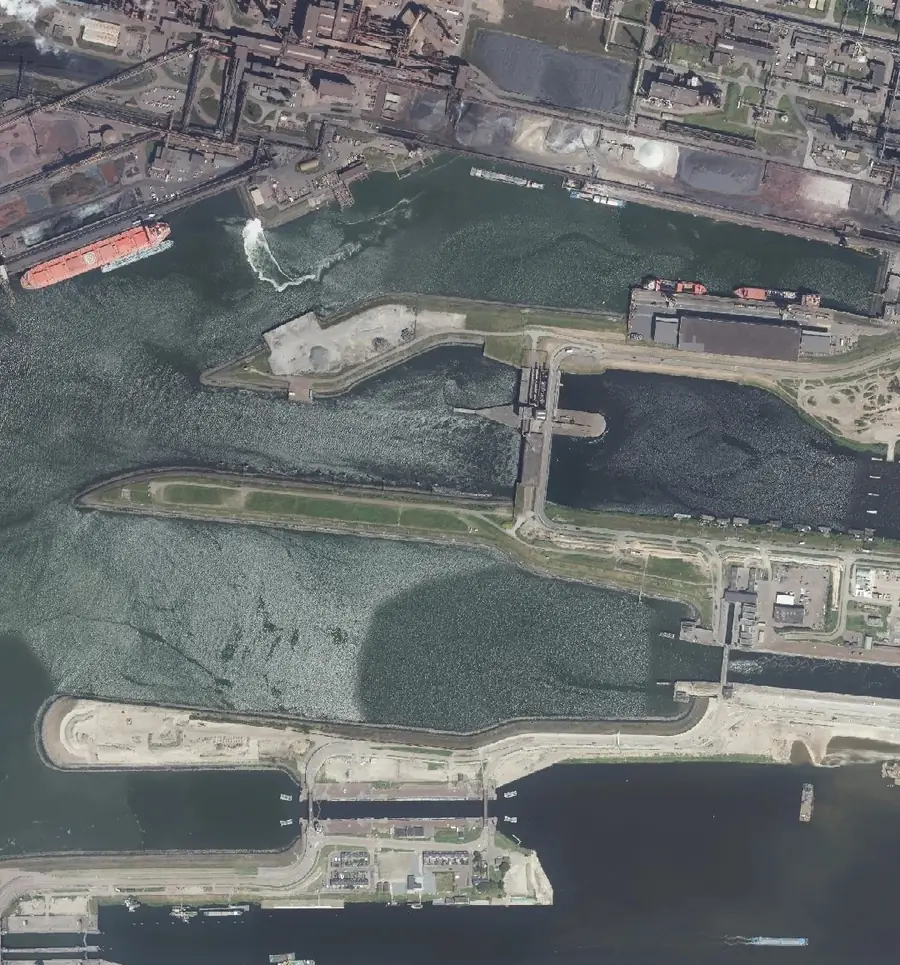
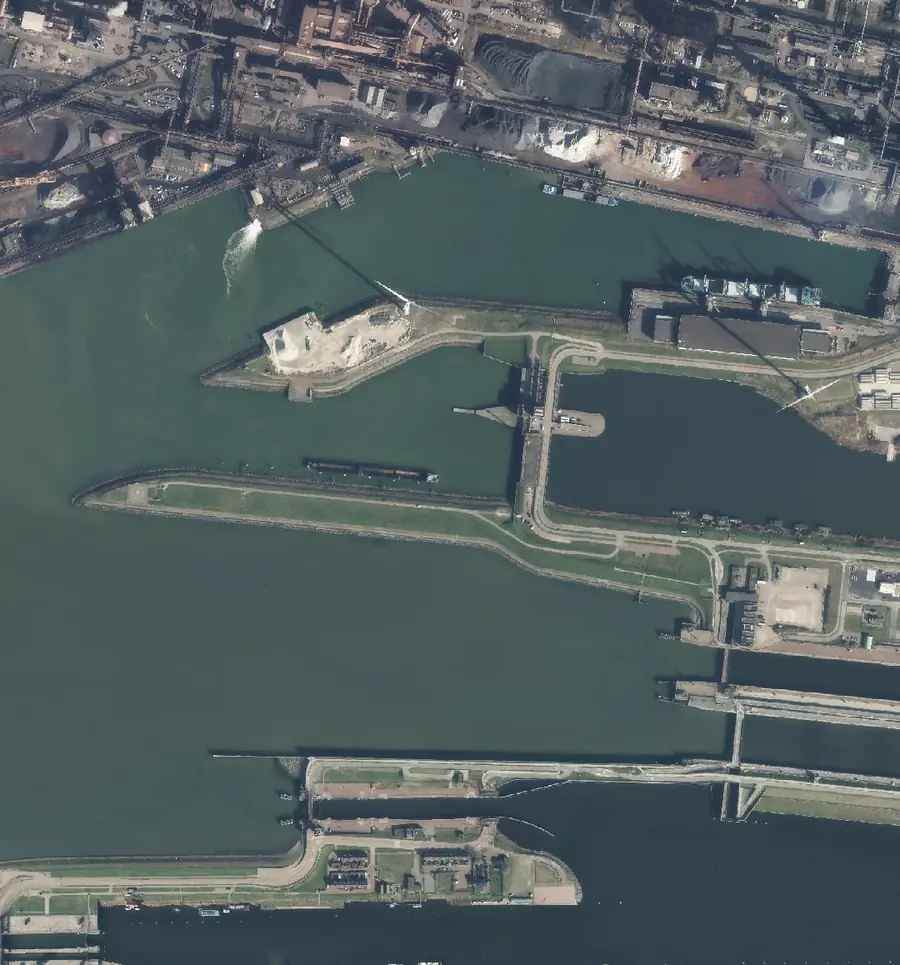
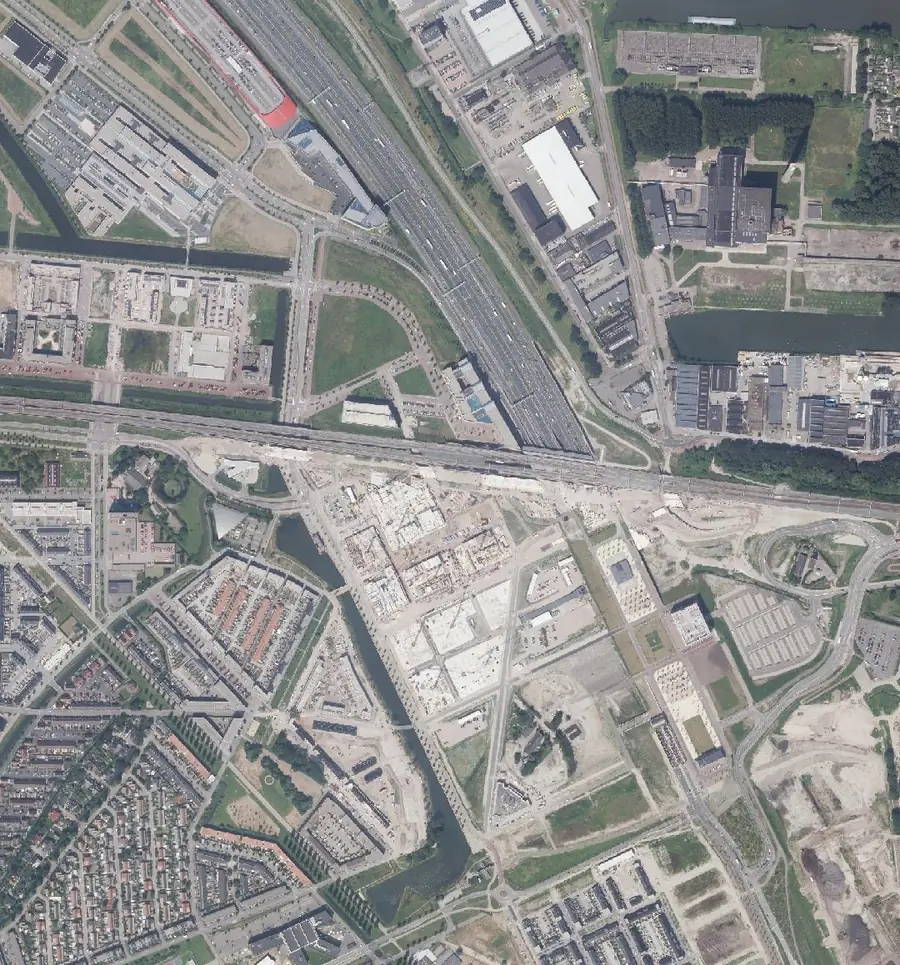
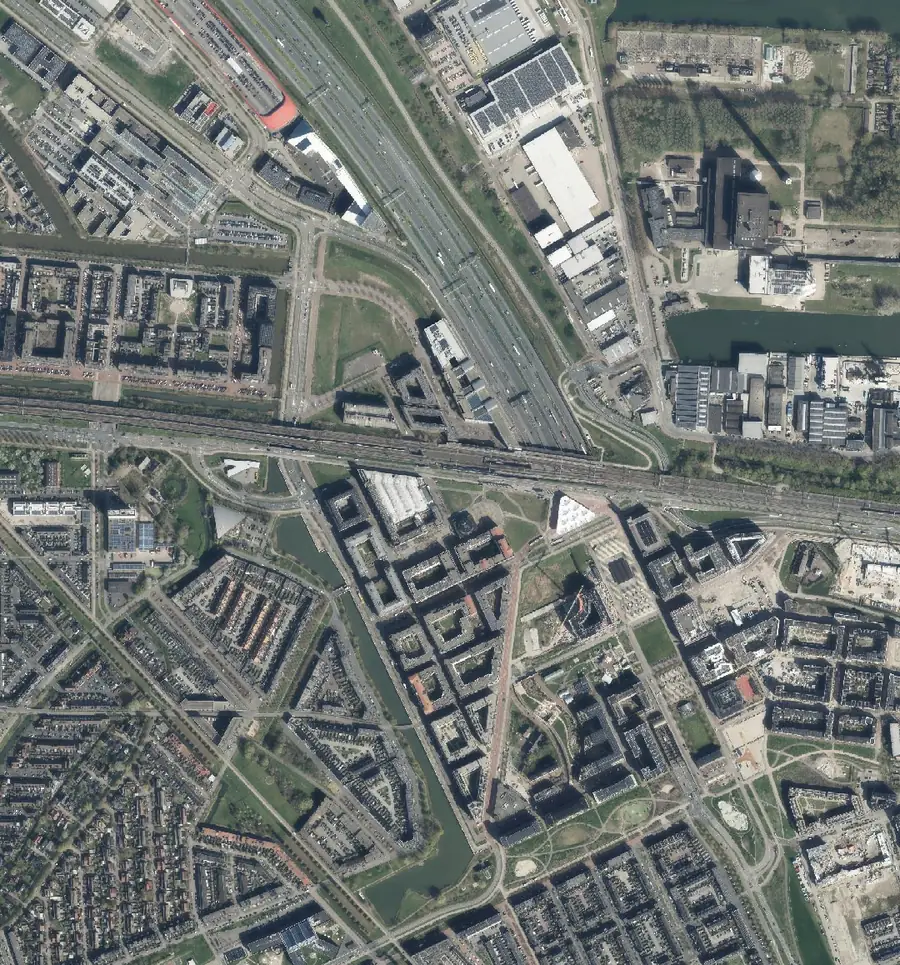
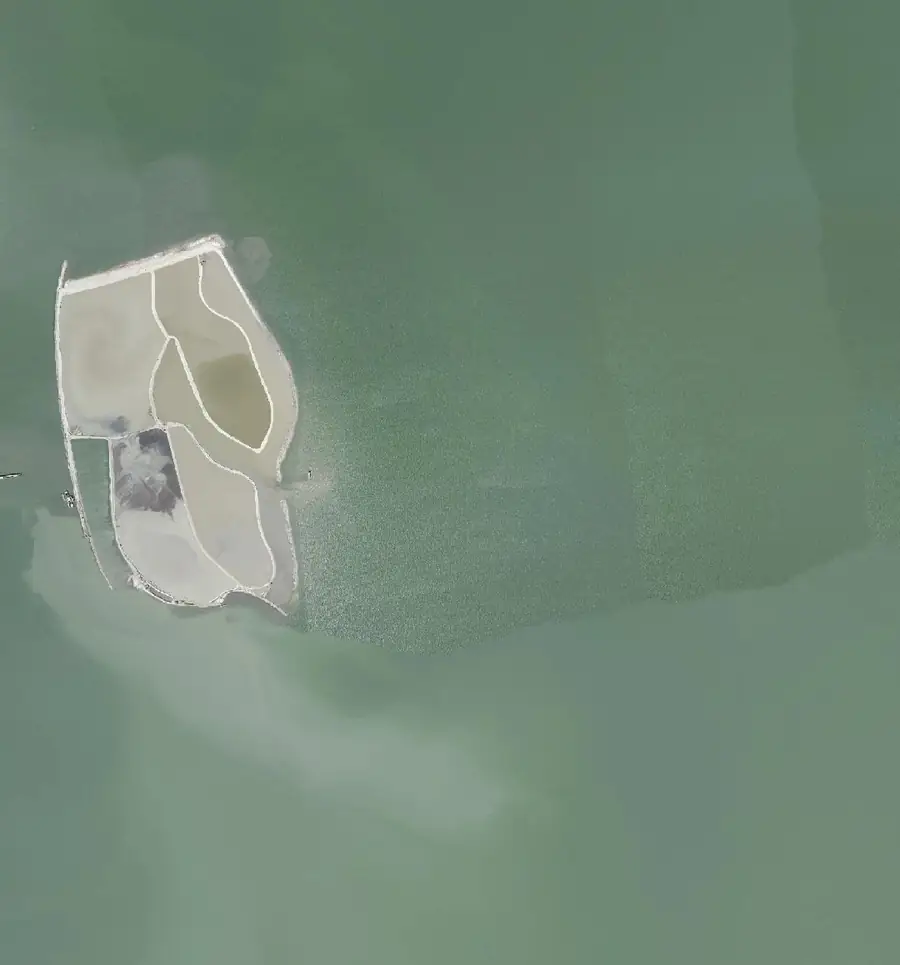
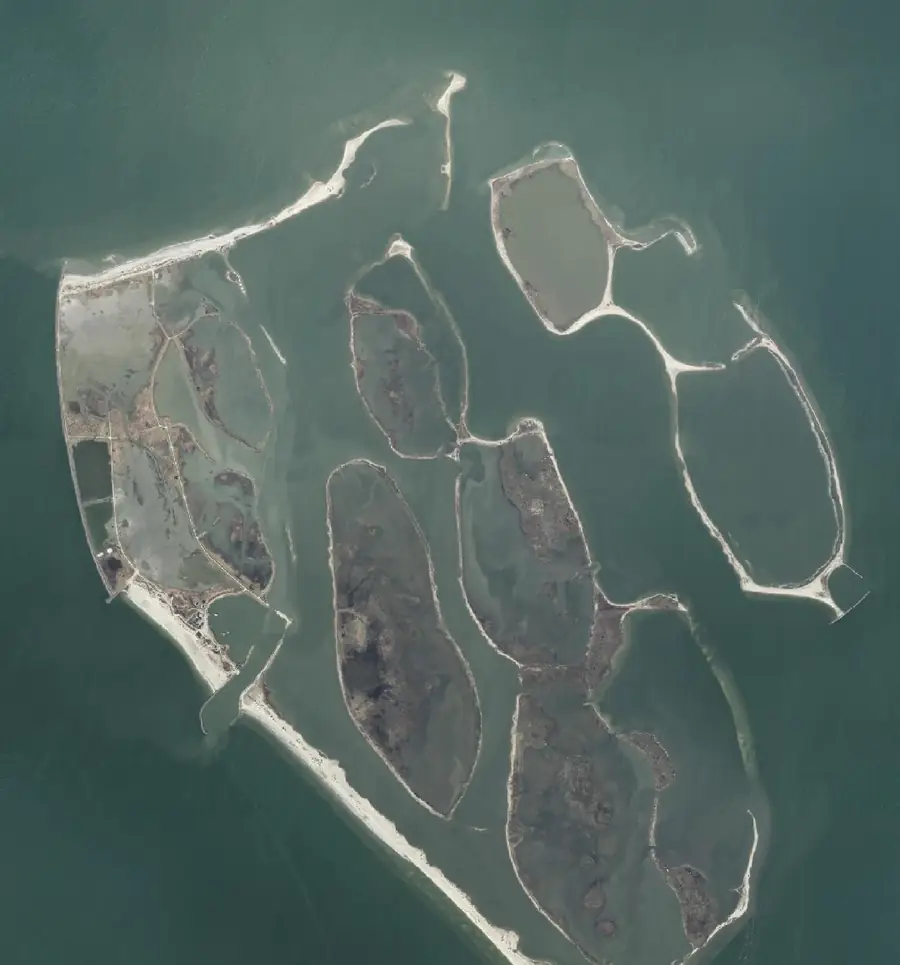
The yearly national aerial photos are what our human audits check the satellite results against. Four places, 2016 against 2026. Drag the handle, or focus the slider and use the arrow keys.
Why aerial photos
The ground truth behind the audits.
The Netherlands flies the whole country every year at 8 to 25 cm. That is far too costly to buy for monthly monitoring, which is why the product runs on the open 10 m Sentinel archive. But it is exactly what a human reviewer needs to judge whether a detected site is real, so it sits behind every audit figure we publish.
How we check the dataAerial photos: Beeldmateriaal Nederland / PDOK.
Building by building
Amsterdam's IJ waterfront in 3D.
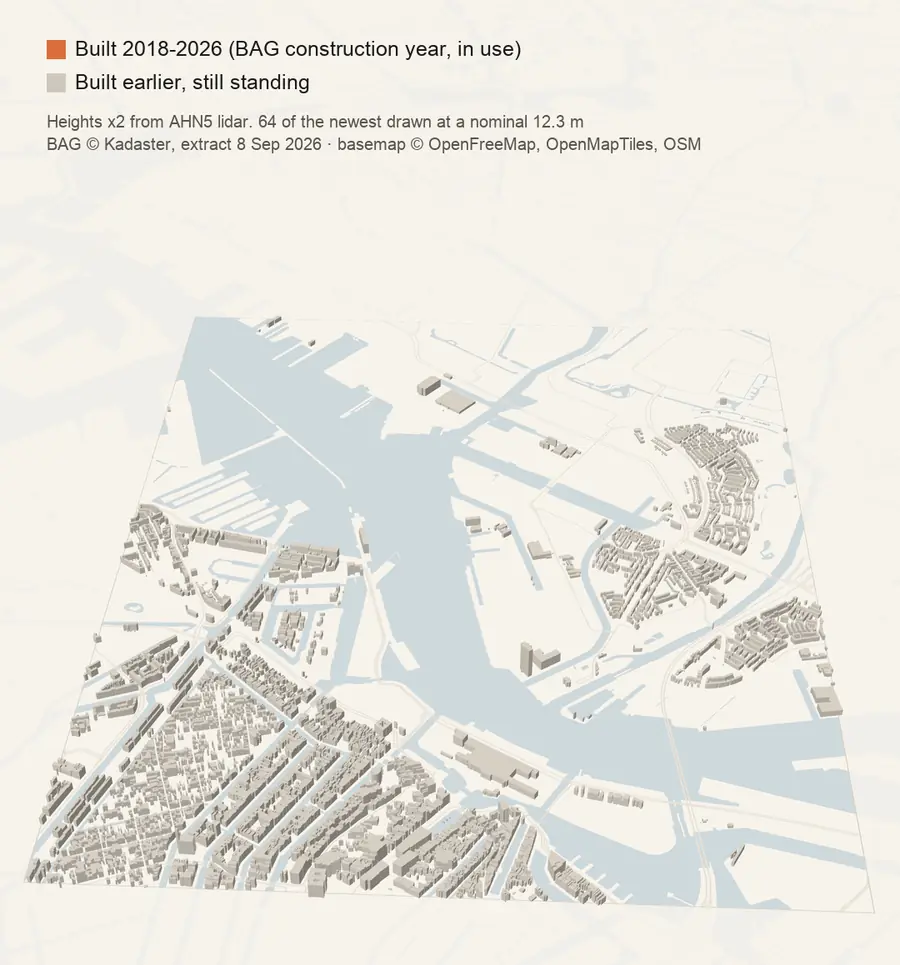
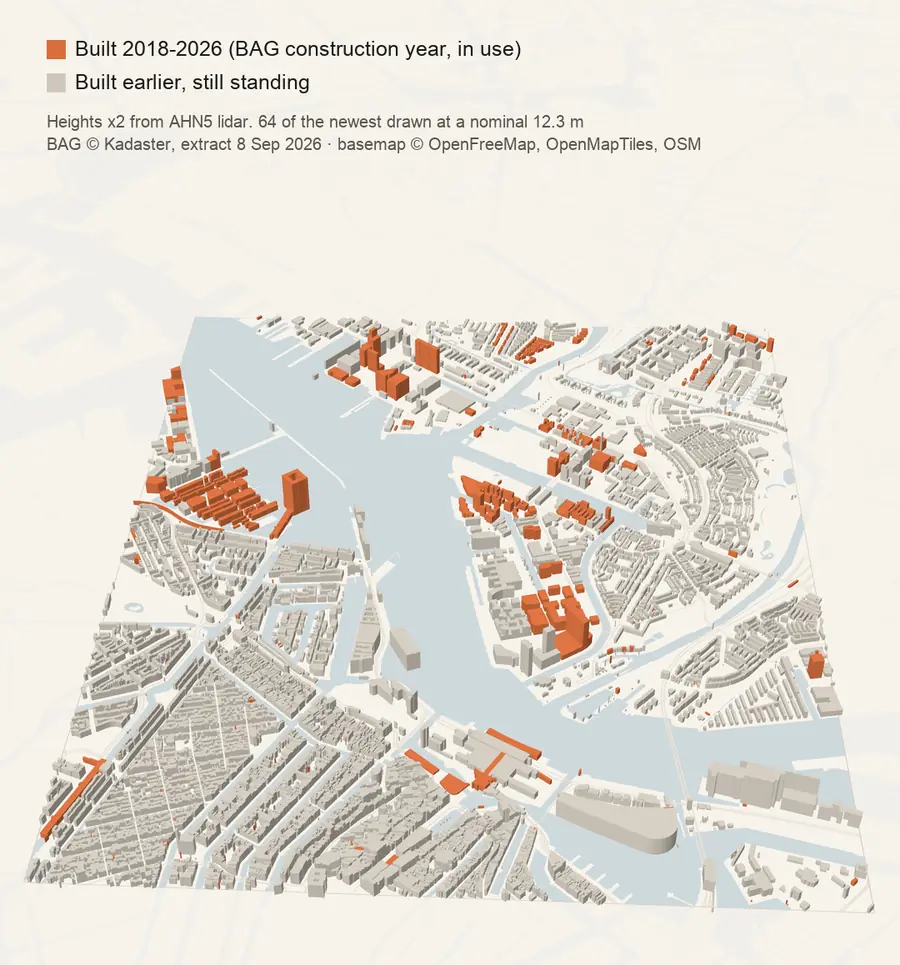
Grey buildings rise in order of their construction year in the Dutch building register. Then every building with a construction year from 2018 to 2026 drops in, in orange, one year at a time. In this 3.1 by 3.9 km frame that is 1,191 of the 17,985 buildings standing today.
Films
The product in motion.
Resources
10 datasets every real estate professional should know (+1).
Most building datasets tell you what exists. Almost none tell you what is being built. The free ones real estate teams actually reach for, with the link, the licence and the catch for each.
Think you know your city?
Drop five pins where you think construction started since 2018, then see the real map. About 60 seconds, no sign-up.